Skip Ahead
- Download market data from Bybit Tutorial - Beginner tutorial on getting market data from Bybit API
- Step 1: Setting Up Your Environment
- Step 2: Timestamp Conversion
- Step 3: Interval to Milliseconds Conversion
- Step 4: Fetching Bitcoin Data Iteratively
- Step 5: Converting Data to DataFrame
- Example Usage
- Conclusion
Download market data from Bybit Tutorial - Beginner tutorial on getting market data from Bybit API
In our previous tutorial we learnt out how start using the Bybit API. However, the market kline endpoint to get OHLC data only extends to 200 bars. In this tutorial we will write code so taht we can get OHLC price data for any specified date range.
Whether you're a trader, a data analyst, or just a cryptocurrency enthusiast, this tutorial is a great starting point to understand market data retrieval from Bybit.
Step 1: Setting Up Your Environment
Install necessary Python packages.
import pandas as pd
from pybit.unified_trading import HTTP
from datetime import datetime
import time
Step 2: Timestamp Conversion
This function converts a Python datetime object to a Unix timestamp in milliseconds. This is essential because the Bybit API requires time parameters in this format.
def timestamp_ms(dt):
    return int(time.mktime(dt.timetuple()) * 1000)
Step 3: Interval to Milliseconds Conversion:
The Bybit API needs the interval for data retrieval in milliseconds. This function maps a human-readable interval string (like '1D' for one day) to its equivalent in milliseconds.
def get_interval_milliseconds(interval):

    interval_map = {
      '1': 60000,         # 1 minute
      '3': 180000,        # 3 minutes
      '5': 300000,        # 5 minutes
      '15': 900000,       # 15 minutes
      '30': 1800000,      # 30 minutes
      '60': 3600000,      # 1 hour
      'D': 86400000,      # 1 day
      'W': 604800000,     # 1 week
      'M': 2592000000,    # Roughly 1 month (30 days)
  }
  return interval_map.get(interval, 3600000)  # Default to 1 hour if interval not found
Step 4: Fetching Bitcoin Data Iteratively
This is the core function where the actual API calls are made. It iteratively fetches data between specified start and end dates. The function uses the Pybit library to interact with the Bybit API.
It checks for errors and empty responses to ensure the data retrieved is valid.
def fetch_bitcoin_data_iteratively(category, symbol, interval, start_datetime, end_datetime, limit=200):
    session = HTTP(testnet=False)
    all_data = []

    # Convert datetime to timestamp in milliseconds
    current_end_timestamp = timestamp_ms(end_datetime)
    start_timestamp = timestamp_ms(start_datetime)

    interval_ms = get_interval_milliseconds(interval)

    while True:
        response = session.get_kline(
            category=category,
            symbol=symbol,
            interval=interval,
            start=start_timestamp,
            end=current_end_timestamp,
            limit=limit
        )

        if response['retCode'] != 0:
            print("Error fetching data:", response['retMsg'])
            break

        candles = response['result']['list']
        if not candles:  # Check if candles list is empty
            print("No data returned for the given time range.")
            break

        all_data.extend(candles)

        # Update the current_end_timestamp to the earliest timestamp in the response
        earliest_timestamp = int(candles[-1][0])
        if earliest_timestamp <= start_timestamp:
            break
        current_end_timestamp = earliest_timestamp - interval_ms

    return all_data
Step 5: Converting Data to DataFrame
Once the data is fetched, this function converts it into a Pandas DataFrame, making it easier to manipulate and analyze. The DataFrame includes columns like 'openPrice', 'highPrice', etc.
def convert_to_dataframe(data, interval):
    # Mapping of intervals to pandas frequency strings
    interval_to_freq = {
        '1': '1min', '3': '3min', '5': '5min', '15': '15min', '30': '30min',
        '60': '1H', '120': '1H', '240': '1H', '360': '1H', '720': '1H',
        'D': '1D', 'W': '1W', 'M': '1M'
    }

    freq = interval_to_freq.get(str(interval), '1min')  # Default to 1 minute if interval not found

    df = pd.DataFrame(data, columns=['startTime', 'openPrice', 'highPrice', 'lowPrice', 'closePrice', 'volume', 'turnover'])
    df['startTime'] = pd.to_datetime(df['startTime'], unit='ms').dt.round(freq)

    for col in ['openPrice', 'highPrice', 'lowPrice', 'closePrice', 'volume', 'turnover']:
        df[col] = pd.to_numeric(df[col])
    return df
Example Usage
This part demonstrates how to call the functions mentioned above with specific parameters, such as the symbol ('BTCUSDT'), interval ('D' for daily), and the start and end dates for data retrieval.
- Setting Up Parameters: Choose your desired cryptocurrency pair (e.g., 'BTCUSDT'), the interval for data (e.g., 'D' for daily), and the start and end dates.
- Executing the Functions: The script will first fetch the raw data using fetch_bitcoin_data_iteratively. Then, it will process this data into a DataFrame using convert_to_dataframe. Finally, it cleans the data by removing outliers using remove_outliers.
- Analysis and Beyond: Once you have the cleaned DataFrame, you can use it for various analyses like price trend analysis, volatility computation, etc.
# Example usage
if __name__ == "__main__":
    category = "linear"
    symbol = "BTCUSDT"
    interval = 'D' # 1 month interval
    start_datetime = datetime(2021, 1, 1, 0, 0)
    end_datetime = datetime(2023, 12, 17, 0, 0)

    raw_data = fetch_bitcoin_data_iteratively(category, symbol, interval, start_datetime, end_datetime)
    bitcoin_df = convert_to_dataframe(raw_data, interval)
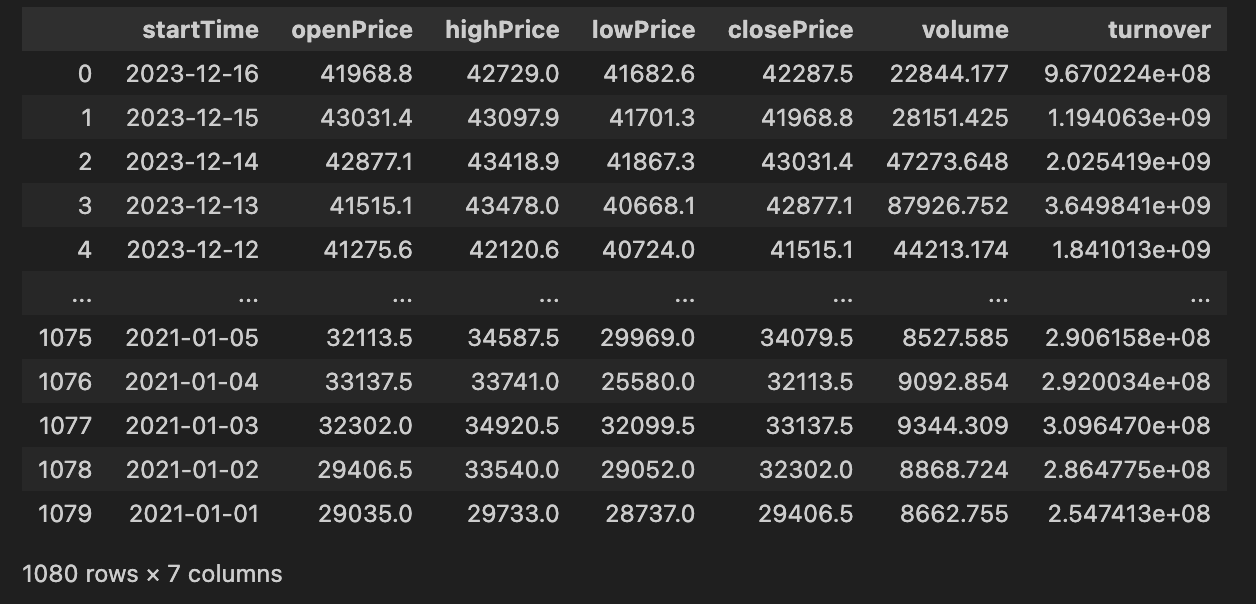
The above Python code will produce the below dataframe:

Conclusion
This tutorial provided a step-by-step guide to fetching and processing cryptocurrency market data from the Bybit API using Python. With this knowledge, you can modify the script to suit your specific requirements, be it for different cryptocurrencies, varied time intervals, or more complex data analyses.
