Skip Ahead
- Bybit API tutorial for beginners
- Step 1: Setting Up Your Environment
- Step 2: Getting Your API Keys
- Step 3: Initializing pybit
- Step 4: Fetching Latest Market Data about a ticker
- Step 5: Getting Instruments Info
- Step 6: Fetching Historical OHLC Market Data (Candlesticks/Klines)
- Step 7: Accessing the Orderbook
- Step 8: Retrieving Funding Rate History
- Step 9: Querying Open Interest
- Step 10: Querying Historical Volatility for Options
Bybit API tutorial for beginners
How to access Bybit API v5 with Python
In this tutorial you will learn how to access basic information about the Bybit crypto exchange with Python through the Bybit API. By accessing Bybit with Python, you can begin to pull public information from Bybit automatically and start to create your own profitable trading bots.

Step 1: Setting Up Your Environment
Install necessary Python packages, mainly pandas and PyBit, which the official Python3 API connector for Bybit's HTTP and WebSockets APIs. You can install it using pip:
!pip install pybit
!pip install pandas
pybit is a Python SDK designed to simplify interactions with the Bybit API. It streamlines the process of executing trades, accessing market data, and managing your account, allowing you to focus on your trading strategies rather than the intricacies of API calls.
Step 2: Getting Your API Keys
Install necessary Python packages, mainly pandas and PyBit, which the official Python3 API connector for Bybit's HTTP and WebSockets APIs. You can install it using pip:
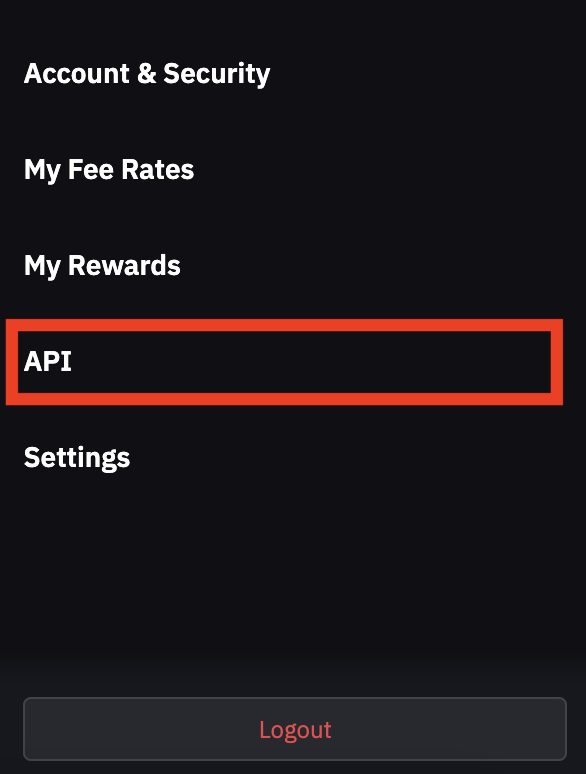
- Log into your Bybit account.
- Navigate to the API Management section.
- Create a new API key. Note down your API Key and API Secret; you'll need them soon.

Step 3: Initializing pybit
- Import pybit in your Python script.
- Initialize the HTTP client with your API Key and Secret, like so:
from pybit.unified_trading import HTTP

session = HTTP(testnet=False)
Step 4: Fetching Latest Market Data about a ticker
Fetching market data is straightforward with pybit. For example, to get the latest price, funding rate, volume and other metrics for BTCUSDT perpetual:
session.get_tickers(
      category="linear",
      symbol="BTCUSDT",
  )
Result:
{
  "retCode": 0,
  "retMsg": "OK",
  "result": {
    "category": "linear",
    "list": [
      {
        "symbol": "BTCUSDT",
        "lastPrice": "39770.20",
        "indexPrice": "39771.93",
        "markPrice": "39775.03",
        "prevPrice24h": "40120.00",
        "price24hPcnt": "-0.008718",
        "highPrice24h": "40246.90",
        "lowPrice24h": "38531.50",
        "prevPrice1h": "39648.90",
        "openInterest": "57762.373",
        "openInterestValue": "2297500118.95",
        "turnover24h": "7757442995.1930",
        "volume24h": "197563.6370",
        "fundingRate": "0.0001",
        "nextFundingTime": "1706083200000",
        "predictedDeliveryPrice": "",
        "basisRate": "",
        "deliveryFeeRate": "",
        "deliveryTime": "0",
        "ask1Size": "3.463",
        "bid1Price": "39770.10",
        "ask1Price": "39770.20",
        "bid1Size": "5.496",
        "basis": ""
      }
    ]
  },
  "retExtInfo": {},
  "time": 1706073334937
}
As you can see, thes result provides us with a JSON of useful information we can use in trading including last price, index price, OHLC, volume, current open interest, live best bid-ask and funding rate. For any futures with expiry (such as BTC Quarterly expiries), there is also a 'basis' field which tells us the price difference between the derivative and the underlying
Step 5: Getting Instruments Info
One of the key functionalities of pybit is accessing detailed information about trading pairs. To get the specifications of online trading pairs:
session = HTTP(testnet=False)
print(session.get_instruments_info(
    category="linear",
    symbol="BTCUSDT",
))
This function retrieves specifications like the symbol, price scale, order size, and more, providing a comprehensive view of each trading pair available on Bybit.
Step 6: Fetching Historical OHLC Market Data (Candlesticks/Klines)
Historical data analysis is crucial in trading. pybit allows you to fetch kline or candlestick data which includes open, high, low and close data. This will be crucial for performing price analysis and developing trading indicators. Below we will download the daily OHLC data between the 12th of October 2023 and 12th of November 2023:
# Define the start and end times using datetime
start_time = datetime(2023, 11, 10)  # Example: 12 October 2023
end_time = datetime(2023, 12, 11)    # Example: 11 December 2023

# Convert start and end times to timestamps
start_timestamp = int(time.mktime(start_time.timetuple()) * 1000)
end_timestamp = int(time.mktime(end_time.timetuple()) * 1000)

# Get the kline data
data = session.get_kline(
    category="inverse",
    symbol="BTCUSD",
    interval="D",  # Assuming 'D' stands for daily interval
    start=start_timestamp,
    end=end_timestamp
)
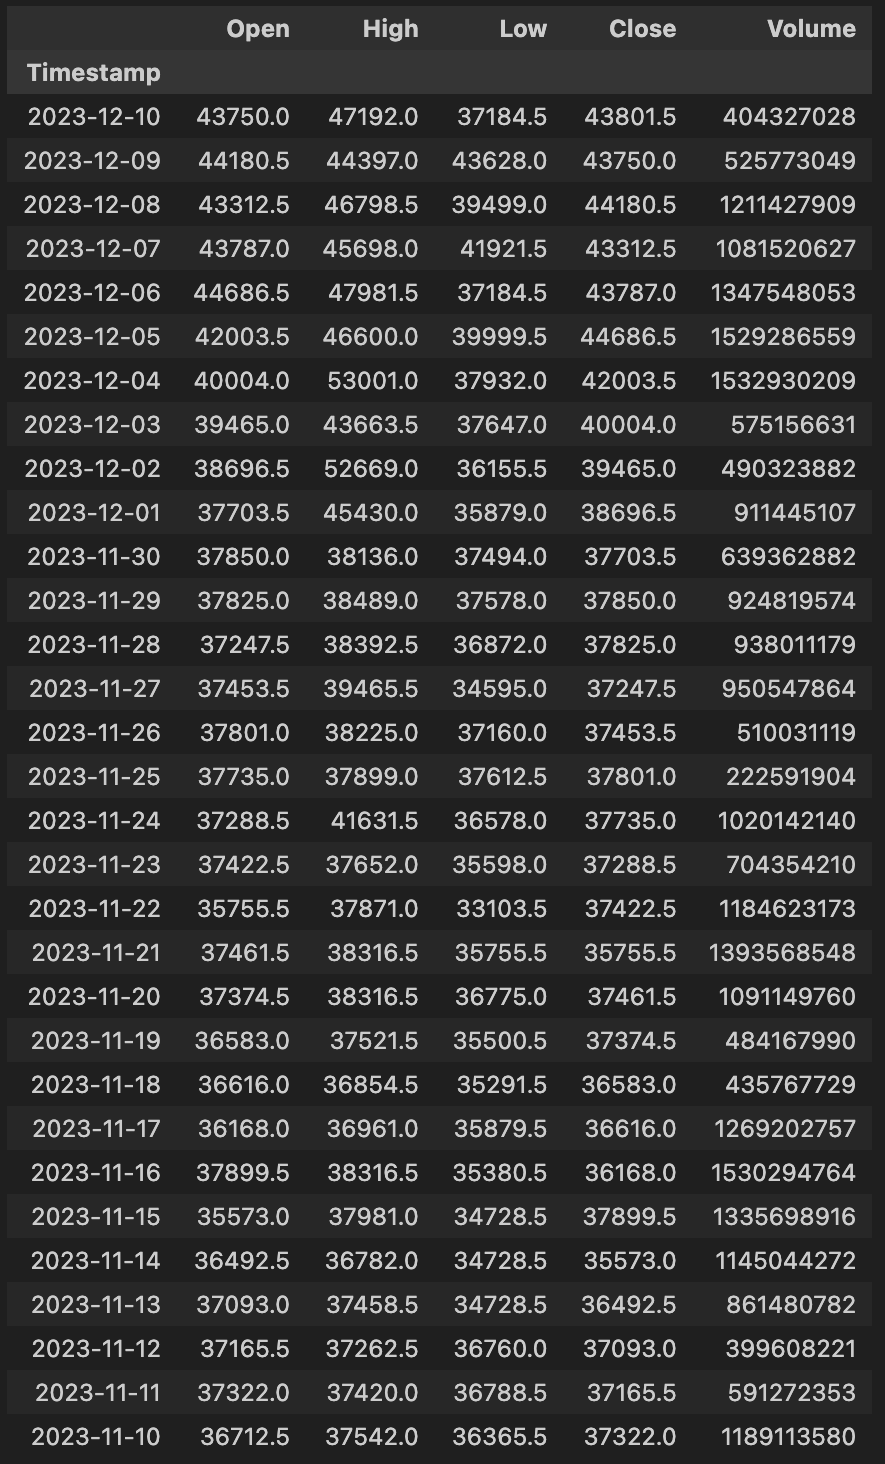
After we've downloaded the data from Bybit, will will need to process it into a more readable format such as a pandas dataframe. Our dataframe will contain the daily Open, High, Low and Close of Bitcoin perpetuals price. We will also write some code to convert the timestamps into the more useable datetime format. Lastly, we drop any unnecessary columns in the data.
# Extracting the 'list' part of the data
price_data = data['result']['list']

# Creating a DataFrame
df = pd.DataFrame(price_data, columns=['Timestamp', 'Open', 'High', 'Low', 'Close', 'Volume', 'Additional'])

# Convert Timestamp from string to datetime and set as index
df['Timestamp'] = pd.to_datetime(df['Timestamp'].astype(int), unit='ms')
df.set_index('Timestamp', inplace=True)

# Convert other columns to appropriate types (float for prices, int for volume)
df[['Open', 'High', 'Low', 'Close']] = df[['Open', 'High', 'Low', 'Close']].astype(float)
df['Volume'] = df['Volume'].astype(int)

# Optional: Drop the 'Additional' column if not needed
df = df.drop(columns=['Additional'])
df
The above Python code will produce the below dataframe:

Step 7: Accessing the Orderbook
Not only can you get OHLC data from the past, you can also pull data about the current state of the orderbook. An order book is an electronic registry of buy and sell orders organized by price level for specific cryptocurrencies. Understanding market depth is vital for trading decisions. With pybit, you can query the orderbook depth data like below:
order_book_data = session.get_orderbook(
      category="linear",
      symbol="BTCUSDT",
)
Step 8: Retrieving Funding Rate History
Funding rates are important in perpetual contracts trading. Pybit allows you to query historical funding rates:
order_book_data = session.get_orderbook(
      category="linear",
      symbol="BTCUSDT",
)
Step 9: Querying Open Interest
Open interest indicates the total number of outstanding derivative contracts. Pybit allows you to fetch the historical open interest of a contract:
# Define the start and end times using datetime
    start_time = datetime(2023, 11, 10)  # Example: December 10, 2022
    end_time = datetime(2023, 12, 11)    # Example: December 11, 2022

    # Convert start and end times to timestamps
    start_timestamp = int(time.mktime(start_time.timetuple()) * 1000)
    end_timestamp = int(time.mktime(end_time.timetuple()) * 1000)

    session.get_open_interest(
        category="linear",
        symbol="BTCUSDT",
        intervalTime="5min",
        startTime=start_timestamp,
        endTime=end_timestamp,
    )
Step 10: Querying Historical Volatility for Options
Volatility is a critical metric in options trading, as it measures the degree of variation in the price of the underlying asset over time. It's essential for assessing risk and potential reward in options trading. High volatility often indicates a higher risk and potentially higher returns, whereas low volatility suggests less risk and possibly lower returns.
In Pybit, you can easily query historical volatility for options. This feature allows you to analyze how volatile an asset has been over a specific period, which is invaluable for making informed trading decisions.
To query historical volatility:
historical_volatility = session.get_historical_volatility(
      category="option",
      baseCoin="ETH",
      period=30,
  )

print(historical_volatility)
In this example, we query the historical volatility of Ethereum (ETH) options with a period of 30 days. The response includes the volatility value and the corresponding timestamp, giving you a clear view of the asset’s volatility over the selected period.
Using this function, you can gain a deeper understanding of the market’s behavior, enabling you to make more strategic decisions in options trading. Remember, understanding volatility is key to navigating the options market effectively.
